Logging API
Contents
Features
- A logger belongs to a "domain", this enables us to change log level settings more selectively
- The log format can be customized
- The color of a log entry can be customized based on logger domain and logger level
- Logger settings can be changed in the settings.json file
- No std::endl at the end of a log entry required
- Thread-safe
- Macros for tracing the application flow
- Provides stream-like and function-like logging
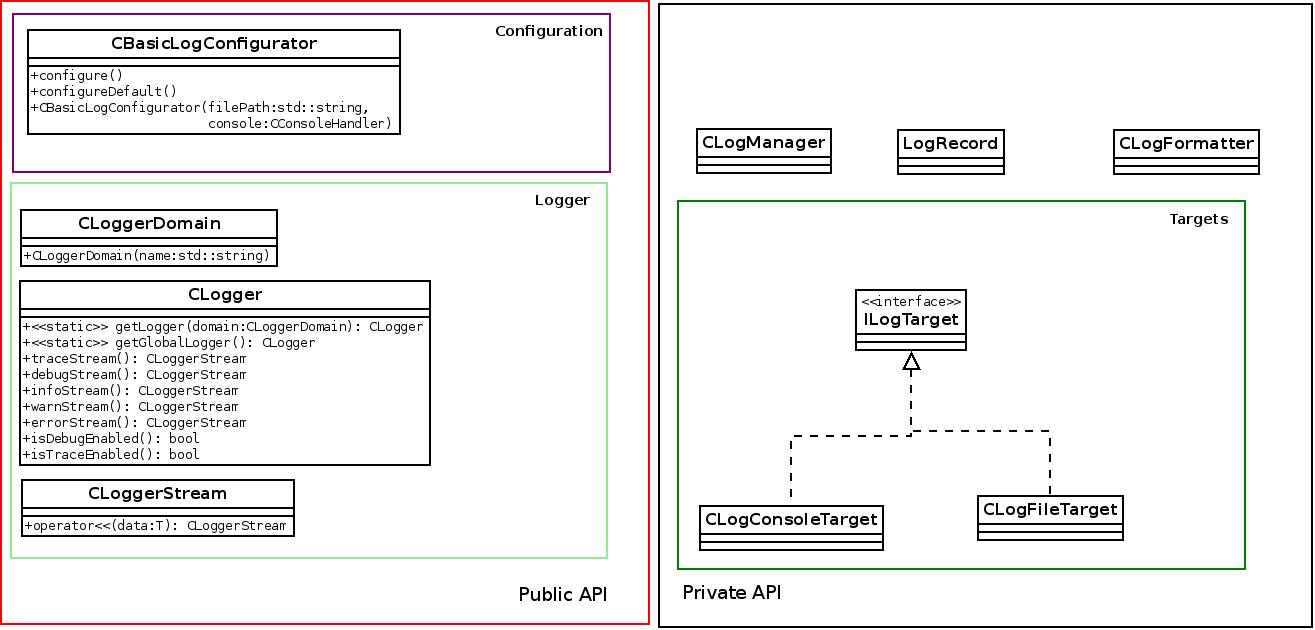
Class diagram
Some notes:
- There are two methods configure and configureDefault of the class CBasicLogConfigurator to initialize and setup the logging system. The latter one setups default logging and isn't dependent on VCMI's filesystem, whereas the first one setups logging based on the user's settings which can be configured in the settings.json.
- The methods isDebugEnabled and isTraceEnabled return true if a log record of level debug respectively trace will be logged. This can be useful if composing the log message is a expensive task and performance is important.
Usage
Setup settings.json
{
    "logging" : {
        "console" : {
            "threshold" : "debug",
            "colorMapping" : [
                {
                    "domain" : "network",
                    "level" : "trace",
                    "color" : "magenta"
                }
            ]
        },
        "loggers" : [
            {
                "domain" : "global",
                "level" : "debug"
            },
            {
                "domain" : "ai",
                "level" : "trace"
            }
        ]
    }
}
The above code is an example on how to configure logging. It sets the log level to debug globally and the log level of the domain ai to trace. In addition, it tells the console to log debug messages as well with the threshold attribute. Finally, it configures the console so that it logs network trace messages in magenta.
Configuration
The following code shows how the logging system can be configured:
console = new CConsoleHandler;
CBasicLogConfigurator logConfig(VCMIDirs::get().localPath() + "/VCMI_Server_log.txt", console);
logConfig.configureDefault(); // Initialize default logging due to that the filesystem and settings are not available
preinitDLL(console); // Init filesystem
settings.init(); // Init settings
logConfig.configure(); // Now setup "real" logging system, overwrites default settings
If configureDefault or configure won't be called, then logs aren't written either to the console or to the file. The default logging setups a system like this:
Console
Format: %m
Threshold: info
coloredOutputEnabled: true
colorMapping: trace -> gray, debug -> white, info -> green, warn -> yellow, error -> red
File
Format: %d %l %n [%t] - %m
Loggers
global -> info
How to get a logger
There exist only one logger object per domain. A logger object cannot be copied. You can get access to a logger object by using the globally defined ones like logGlobal or logAi, etc... or by getting one manually:
CLogger * logger = CLogger::getLogger(CLoggerDomain("rmg"));
Logging
Logging can be done via two ways, stream-like or function-like.
logGlobal->warnStream() << "Call to loadBitmap with void fname!";
logGlobal->warn("Call to loadBitmap with void fname!");
Don't include a '\n' or std::endl at the end of your log message, a new line will be appended automatically.
The following list shows several log levels from the highest one to the lowest one:
- error -> for errors, e.g. if resource is not available, if a initialization fault has occured, if a exception has been thrown (can result in program termination)
- warn -> for warnings, e.g. if sth. is wrong, but the program can continue execution "normally"
- info -> informational messages, e.g. Filesystem initialized, Map loaded, Server started, etc...
- debug -> for debugging, e.g. hero moved to (12,3,0), direction 3', 'following artifacts influence X: .. or pattern detected at pos (10,15,0), p-nr. 30, flip 1, repl. 'D'
- trace -> for logging the control flow, the execution progress or fine-grained events, e.g. hero movement completed, entering CMapEditManager::updateTerrainViews: posx '10', posy '5', width '10', height '10', mapLevel '0',...
How to trace execution
The program execution can be traced by using the macros TRACE_BEGIN, TRACE_END and their _PARAMS counterparts. This can be important if you want to analyze the operations/internal workings of the AI or the communication of the client-server. In addition, it can help you to find bugs on a foreign VCMI installation with a custom mod configuration.
int calculateMovementPointsForPath(int3 start, int3 end, CHero * hero) // This is just an example, the function is fictive
{
  TRACE_BEGIN_PARAMS(logGlobal, "start '%s', end '%s', hero '%s'", start.toString() % end.toString() % hero.getName()); // toString is fictive as well and returns a string representation of the int3 pos, ....
  int movPoints;
  // Do some stuff
  // ...
  TRACE_END_PARAMS(logGlobal, "movPoints '%i'", movPoints);
  return movPoints;
}
Concepts
Domain
A domain is a specific part of the software. In VCMI there exist several domains:
- network
- ai
- bonus
- network
In addition to these domains, there exist always a super domain called "global". Sub-domains can be created with "ai.battle" or "ai.adventure" for example. The dot between the "ai" and "battle" is important and notes the parent-child relationship of those two domains. A few examples how the log level will be inherited:
global, level=info
network, level=not set, effective level=info
global, level=warn
network, level=trace, effective level=trace
global, level=debug
ai, level=not set, effective level=debug
ai.battle, level=trace, effective level=trace
The same technique is applied to the console colors. If you want to have another debug color for the domain ai, you can explicitely set a color for that domain and level.

